Stay current on industry-related news and updates
Blog
Featured
April 24, 2024
Managing Supply Shortages: Lessons Learned from Recent Headlines
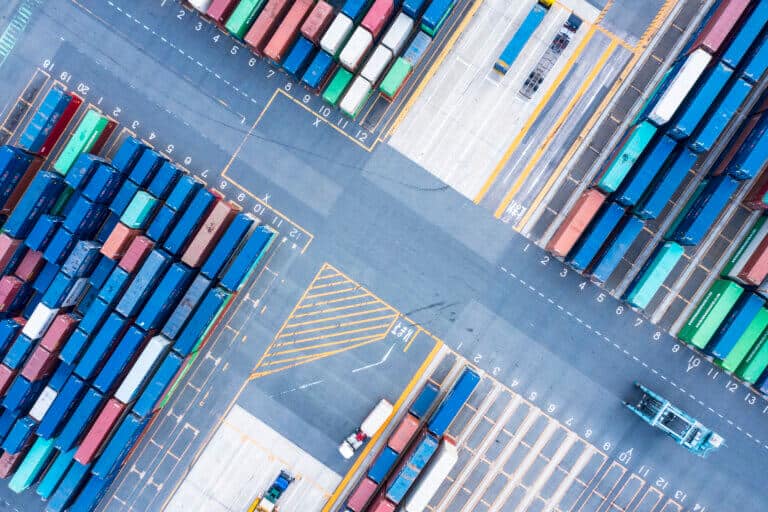
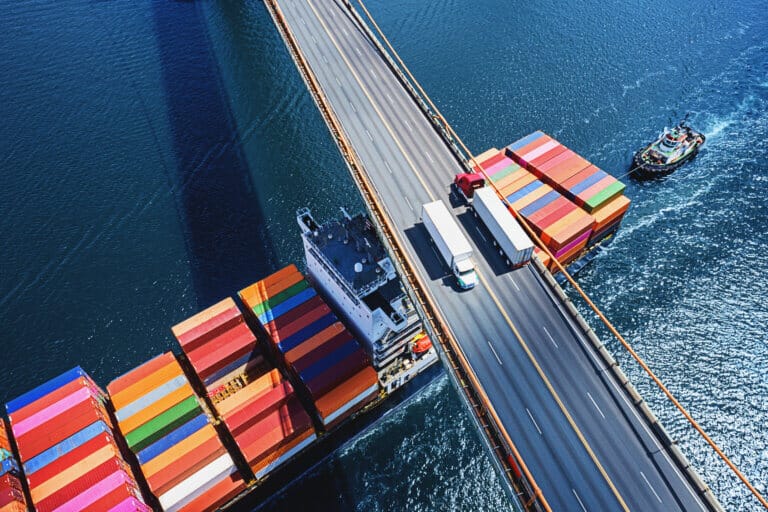
Supply chains are the lifeblood of modern businesses, ensuring the smooth flow of goods and services from manufacturers to end consumers. However, recent events like the Baltimore Port Bridge collapse and the Taiwan earthquake have underscored the vulnerability of these intricate networks. As supply chain leaders, we must learn from these disruptions and proactively address their impact.


April 10, 2024
What will AI in Supply Chains Look Like?

March 15, 2024